The difference between “performance indicators” (PIs) and “key performance indicators” (KPIs) seems obvious. “Key” ones are more important, they are a subset of a larger (and longer) list.
In security, particularly in compliance-driven environments where the information security management system (ISMS) is aligned to a standard, there can be over a hundred controls that must be in place and (ideally) routinely audited, monitoring and reported on.
However, the Pareto principle – that 80% of the results come from 20% of the effort – applies here as in many other disciplines.
Performance indicators
In this environment there are several ways to derive the PIs that are used. Each control could be tracked as being at a level of maturity or level of implementation or coverage.
This is often a master spreadsheet or similar, with the controls and the associated status or maturity. It may even contain more specific details like the percentage of implementation or the number of exceptions.
As a reporting tool though, this isn’t really suitable for a level of management any higher than the security function itself. For one thing two separate controls that are in a low/poor/pending state (and hence non-compliant) might have very different risks associated with them. Both score low, but one low score is much more worrying than the other.
The law of averages
Reporting often takes this ‘master list’ of controls and performs calculations on it (averages, numbers, counts). It then turns this into a KPI for use by the business or more senior stakeholders.
There are numerous ways to achieve this, counting controls of a certain score, averaging the levels, grouping controls into functional categories or even into groups according to status.
You might get a spider diagram showing each of the control categories, the count/score of controls within that and some mapping against a target. This ‘averaging out’ within a category hides a lot of detail. Controls could have changed markedly between reporting cycles, but if the average stays static then the graph is unchanged. Also, a change in one control has a variable effect depending on how many other controls are in the same group. One control amongst 20 only carries 5% of the overall score whereas one amongst only 3 will change the average by up to 33%. There is a tendency to assume if the average score for a group of controls is 75% that all controls in the group score 75%. Of course, that’s not true – a group of four controls could comprise three at 100% and one that has zero implementation at all.
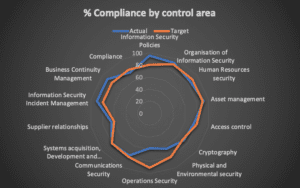
Showing compliance with “rolled-up” groups of performance indicators
The KPI here is likely to be driven by the performance of the ‘achieved’ score versus the ‘target’ one – staying above or equal to what has been determined as ‘good’ – but this hides so much detail. One single control in a group could be failing seriously, but this is masked by reasonable scores elsewhere. Or patching might be 99% compliant, but the one system that hasn’t been patched might be the most mission critical.
If the KPIs are based on exceptions or compliance/control failures, you might have ratings for the severity of the problem. This might result in counts/grouping based on severities, exceptions or deviation ratings; rather than the control category.
Such a KPI might be to have the number of ‘high issues’ below a certain value (‘Less than 10% of non-compliances being rated high’ say). Aside from its inherently subjective nature this again reports on numbers of problems, and in fact the issues that are rated ‘high’ might be the same each time or different each cycle. If one focusses on last months ‘high’ issues it is entirely conceivable that attention taken off other controls leads to them falling behind and becoming ‘high’ in turn.
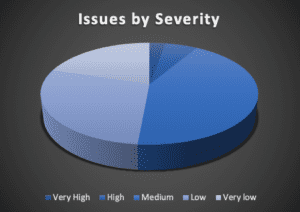
Indicators showing groupings of issues
Finally, there is the duration or ‘age’ of issues. How quickly are problems being detected and resolved. This works well in some arenas, like technical vulnerabilities where they crop up continually and need to be addressed. It lends itself best to shorter reporting cycles – vulnerabilities, alert triage, backup failures – and not all of the security disciplines operate like that.
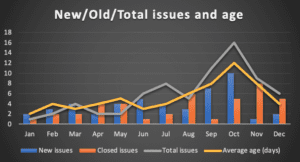
Indicators showing numbers of issues and trends over time
None of these reporting approaches convey anything other than counting problems in different ways; there is no information that shows how individual controls have changed except as they change the average or count of a certain parameter.
True KPIs
The goal of security leaders is to improve security maturity and to deliver a set of metrics to the business that shows the effectiveness of security controls and operational performance.
Looking at the pattern of attacks and breaches that take place (for example, in FTC/Equifax, Verizon DBIR etc.) while all security controls matter, some have more of an impact than others in stopping data thefts and network-based attacks.
In terms of operational reporting (whether continuous monitoring or periodic audit) taking this ‘most relevant’ sample and reporting on them in detail can hold greater value that trying to calculate an aggregate/average/total score across a large range of disparate issues.
A smaller list, derived from specific business risks, might not constitute all the performance indicators, but they are key performance indicators and arguably choosing KPIs in this way is better than deciding that the average (or total) of all PIs to give a mathematical KPI figure.
A good example of a KPI
It is widely acknowledged that patching operating systems and applications is a vital defence. Vulnerabilities that are widely known and often have publicly available exploit code ‘in the wild‘ can be used to access or disrupt systems until the patch is applied. Exploiting a vulnerability like this often leads to such a complete system compromise that other controls (like strong passwords, access controls, file permissions etc.) are circumvented (if you can get administrative access you can turn on or off most other controls like passwords, file permissions and even logs).
Hence the vulnerability management process represents a good ‘key’ control to report the performance of. Inevitably, organisations will still hit similar problems in how they derive a performance figure. Do we score the number of patched versus unpatched systems or the average time that systems are unpatched for? But at least the figure, statistic or percentage related to this single element doesn’t blur across several different and unequal areas of risk.
Service-level KPI reporting
As with many areas of operation, a service level can be defined to help steer performance and reporting. Perhaps ‘All systems must have patches applied at least weekly’ or ‘Critical patches must be installed on critical systems within 2 days’.
Then the score might be the average time that patches take to deploy (on a per patch basis), the frequency of the target being hit (or being missed) at each measurement point or the number of systems that have outstanding patches more than two days old (ideally on a daily/continuous basis).
Of course, there are two challenges here. One is ‘doing’ security, the other is ‘reporting’ on it. But for senior stakeholders seeking visibility or assurance on how their organisation is defended, they are reliant on the second activity – reporting – happening in a meaningful way. Otherwise they probably have to assume the worst about the actual ‘doing’ part.
Using amalgamations of a wider set of scores to derive total or average scores and using these as KPIs isn’t as useful as picking the indicators that are actually ‘key’ and reporting on those. So, choose the security processes that most closely map to the risks faced and define the scoring and services levels that correspond to those. A dashboard showing these KPIs will be more easily received by the business than a lengthy spreadsheet that has its details grouped into vague subsets.
 Essential 8 Scorecard – Trend Report
 Products
 Solutions by Industry
 Learning & Resources
 About Huntsman


